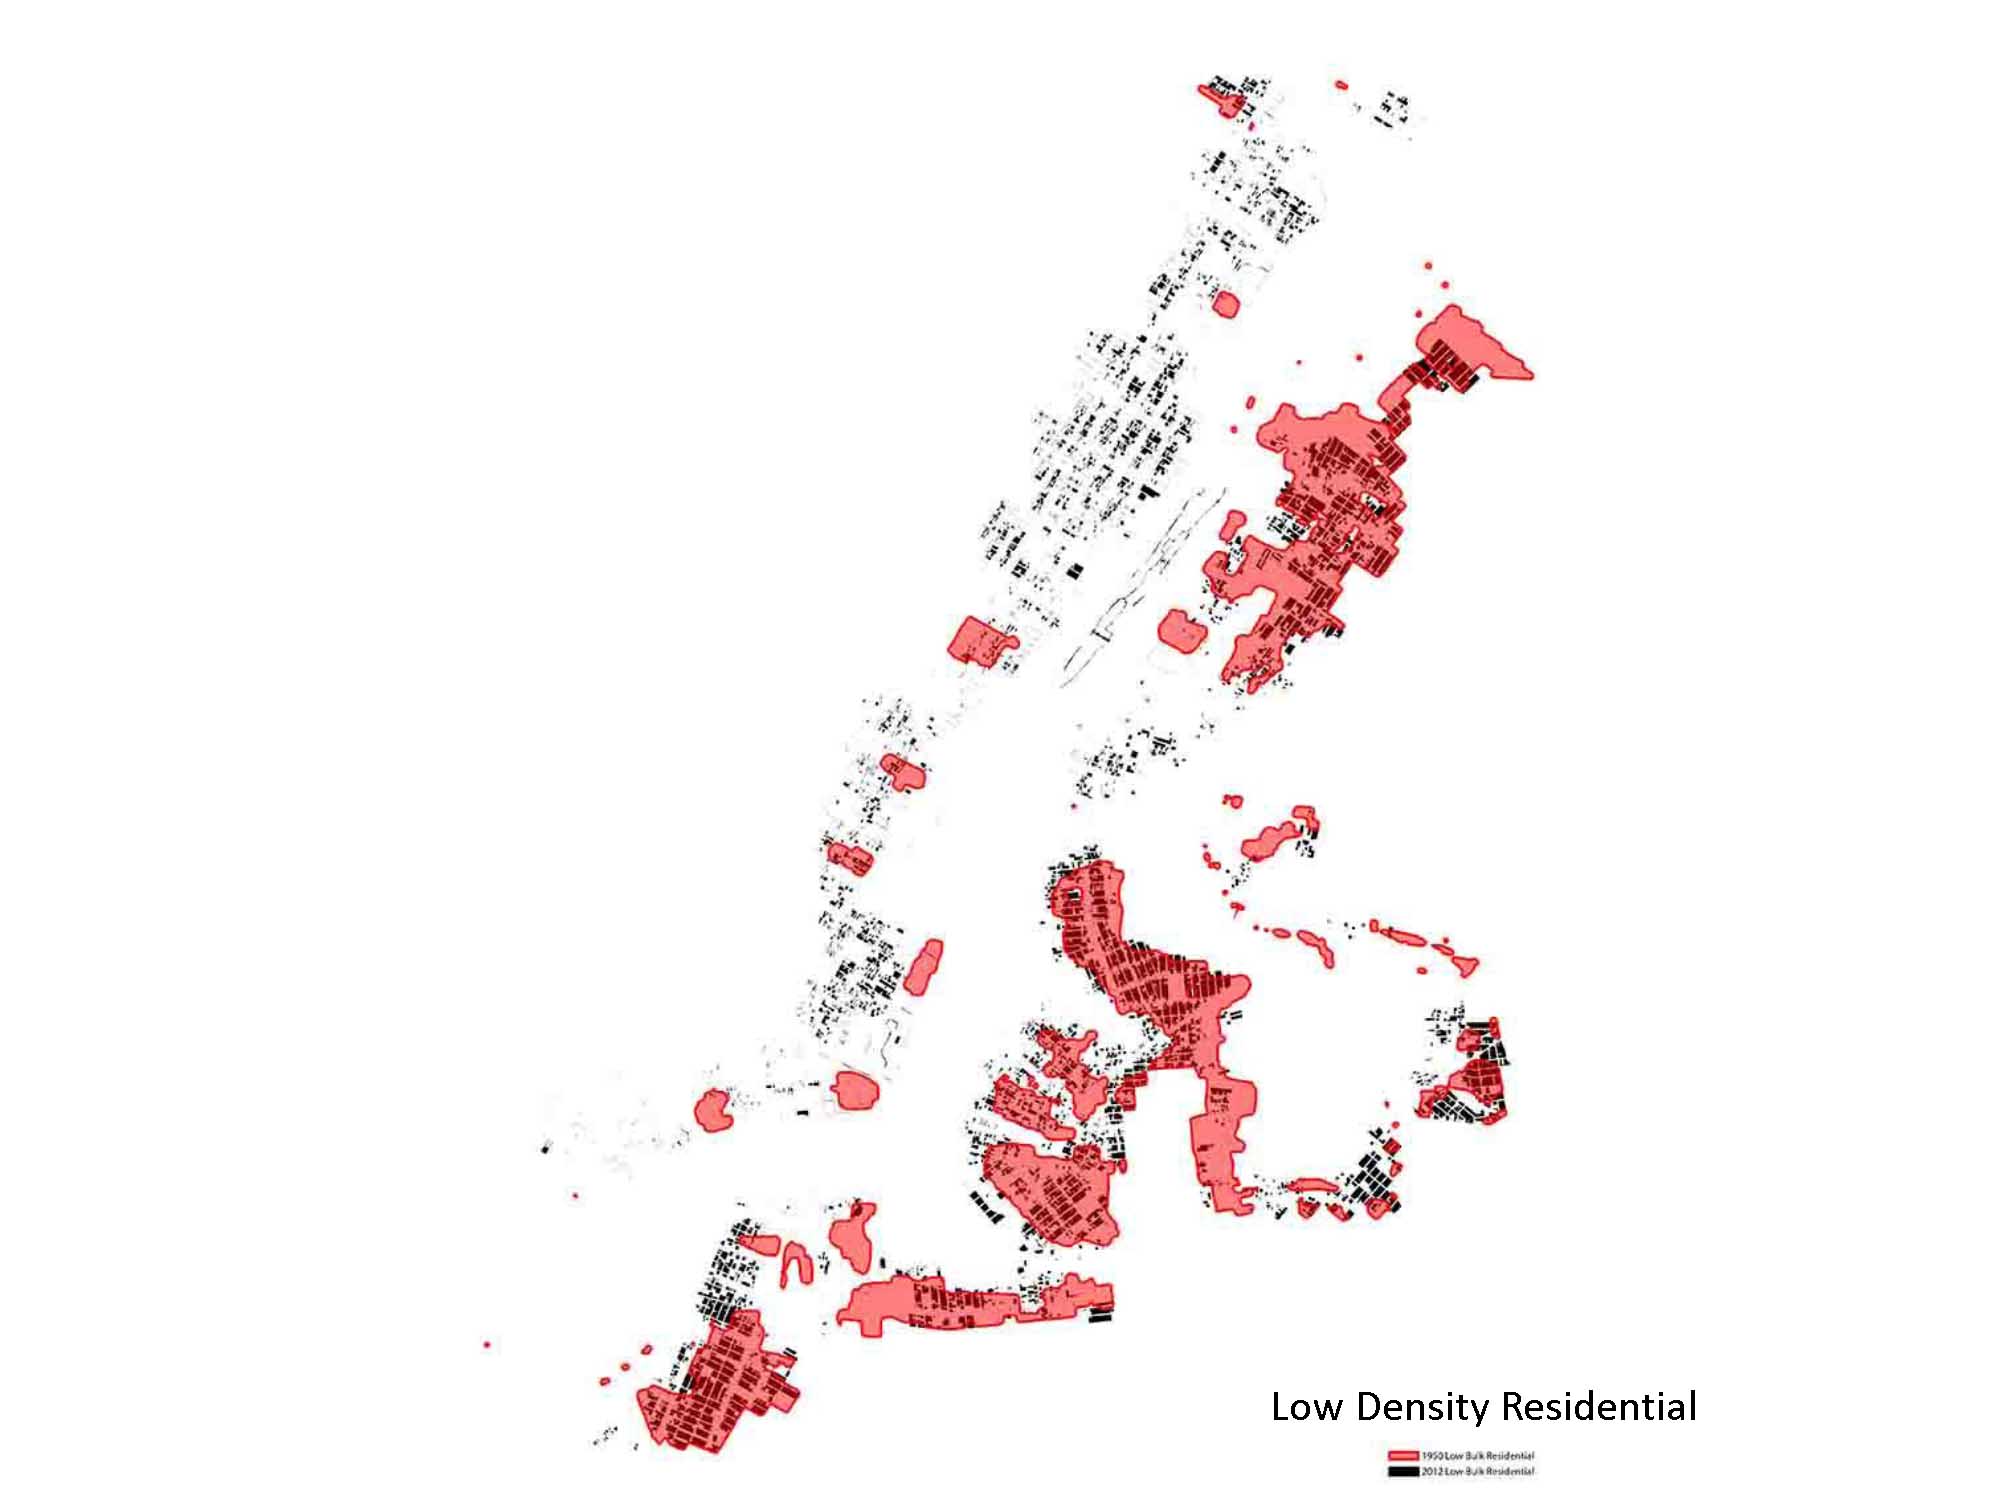
This is an example of how we are gaining resolution in building usage information
Map of tweets during hurricane Sandy
http://senseable.mit.edu/nyte/visuals.html
This is a scenario of the sensors being deployed and the resulting development
All content © Copyright 2026 by cloud of reassembly. Subscribe to RSS Feed – Posts or just Comments
Powered by WordPress Designed by Graph Paper Press